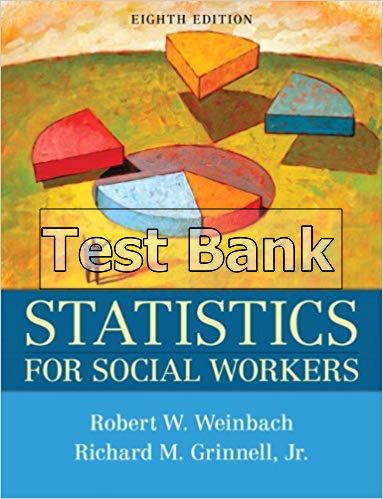
Statistics for Social Workers 8th Edition Weinbach Test Bank
You may also like
Statistics for Social Workers 8th Edition Weinbach Test Bank
Product details:
- ISBN-10 : 0205739873
- ISBN-13 : 978-0205739875
- Author: Robert W. Weinbach
Now in its eighth edition, this widely used text covers the types of statistical analyses that are most likely to be encountered by social work practitioners and researchers. It requires no prior knowledge of statistics and only basic mathematical competence.
Table contents:
1 Introduction
USE OF STATISTICS
METHODOLOGICAL TERMS
Data
Information
Variables and Constants
Conceptualization
Operationalization
Reliability
Validity
RESEARCH HYPOTHESES
Three Forms of Research Hypotheses
Causal and Non-causal Research Hypotheses
Independent and Dependent Variables
MEASUREMENT LEVELS
Nominal
Ordinal
Interval
Ratio
MEASUREMENT LEVELS AND DATA ANALYSIS
ADDITIONAL MEASUREMENT CLASSIFICATIONS
Discrete and Continuous Variables
Dichotomous, Binary, and Dummy Variables
CATEGORIES OF STATISTICAL ANALYSES
Number of Variables in an Analysis
Primary Purpose of the Analysis
CONCLUDING THOUGHTS
STUDY QUESTIONS
2 Frequency Distributions and Graphs
FREQUENCY DISTRIBUTIONS
Absolute Frequency Distributions
Cumulative Frequency Distributions
Percentage Frequency Distributions
Cumulative Percentage Frequency Distributions
GROUPED FREQUENCY DISTRIBUTIONS
USING FREQUENCY DISTRIBUTIONS TO ANALYZE DATA
MISREPRESENTATION OF DATA
GRAPHS
Bar Graphs and Line Diagrams
Pie Charts
Histograms
Frequency Polygons
Stem-and-Leaf Plots
A COMMON MISTAKE IN DISPLAYING DATA
CONCLUDING THOUGHTS
STUDY QUESTIONS
3 Measures of Central Tendency and Variability
MEASURES OF CENTRAL TENDENCY
The Mode
The Median
The Mean
Which Measure of Central Tendency to Use?
MEASURES OF VARIABILITY
The Range
The Interquartile Range
The Mean Deviation
Variance
Standard Deviation
Reporting Measures of Variability
OTHER USES FOR CENTRAL TENDENCY AND VARIABILITY
CONCLUDING THOUGHTS
STUDY QUESTIONS
4 Normal Distributions
SKEWNESS
KURTOSIS
NORMAL DISTRIBUTIONS
CONVERTING RAW SCORES TO Z SCORES AND PERCENTILES
Practical Uses of z Scores
DERIVING RAW SCORES FROM PERCENTILES
CONCLUDING THOUGHTS
STUDY QUESTIONS
5 Hypothesis Testing: Basic Principles
ALTERNATIVE EXPLANATIONS FOR RELATIONSHIPS WITHIN SAMPLES
Rival Hypotheses
Research Design Flaws
Sampling Error
PROBABILITY AND INFERENCE
REFUTING SAMPLING ERROR
Replication
Statistical Analyses
STATISTICAL SIGNIFICANCE
p values
Rejection Levels (Alpha)
ERRORS IN DRAWING CONCLUSIONS ABOUT RELATIONSHIPS
Avoiding Type I Errors
Avoiding Type II Errors
STATISTICALLY SIGNIFICANT RELATIONSHIPS AND MEANINGFUL FINDINGS
More about Effect Size
Is the Relationship Valuable?
Complex Interpretations of Statistically Significant Relationships
THE PROCESS OF HYPOTHESIS TESTING
CONCLUDING THOUGHTS
STUDY QUESTIONS
6 Sampling Distributions, Rejection Regions, and Statistical Test Selection
SAMPLE SIZE AND SAMPLING ERROR
SAMPLING DISTRIBUTIONS AND INFERENCE
Comparing an Experimental Sample with Its Population
Comparing a Non-Experimental Sample with Its Population
SAMPLING DISTRIBUTION OF MEANS
Samples Drawn from Normal Distributions
Samples Drawn from Skewed Distributions
ESTIMATING PARAMETERS
Constructing a 95 Percent Confidence Interval
Constructing a 99 Percent Confidence Interval
SELECTING A STATISTICAL TEST
The Importance of Selecting the Correct Test
Factors to Consider in Selecting the Correct Test
PARAMETRIC AND NONPARAMETRIC TESTS
MULTIVARIATE TESTS
DECIDING WHICH TEST TO USE
More about Getting Help
CONCLUDING THOUGHTS
STUDY QUESTIONS
7 t Tests and Analysis of Variance
THE USE OF t TESTS
Misuse of t
THE ONE-SAMPLE t TEST
Determining If a Sample Is Representative
Seeking Support for a Research Hypothesis
Presentation of Findings
A Nonparametric Alternative: Chi-Square Goodness of Fit
THE DEPENDENT t TEST
Use with Two Connected (or Matched) Samples Measured Once
Use with One Sample Measured Twice
A Nonparametric Alternative: Wilcoxon Sign
THE INDEPENDENT t TEST
Nonparametric Alternatives: U and K-S
A Multivariate Alternative: T2
SIMPLE ANALYSIS OF VARIANCE (SIMPLE ANOVA)
Additional Data Analyses
A Nonparametric Alternative: Kruskal-Wallis
MULTIVARIATE ANALYSIS OF VARIANCE
CONCLUDING THOUGHTS
STUDY QUESTIONS
8 The Chi-square Test of Association Between Variables
WHEN CHI-SQUARE IS APPROPRIATE
CROSS-TABULATION TABLES
Degrees of Freedom
Using Chi-Square
Presentation of Findings
Interpreting the Results of a Chi-Square Analysis
Meaningfulness and Sample Size
Restrictions on the Use of Chi-Square
An Alternative: Fisher’s Exact Test
Using Chi-Square in Social Work Practice
CROSS TABULATION WITH THREE OR MORE VARIABLES
Problems with Sizes of Expected Frequencies
Effects of Introducing Additional Variables
SPECIAL APPLICATIONS OF THE CHI-SQUARE FORMULA
McNemar’s Test
The Median Test
CONCLUDING THOUGHTS
STUDY QUESTIONS
9 Correlation Analyses
USES OF CORRELATION
SCATTERGRAMS
PERFECT CORRELATIONS
NONPERFECT CORRELATIONS
INTERPRETING LINEAR CORRELATIONS
Understanding Correlation Coefficients
Very Strong Correlations
Remember,Correlation Is Not Causation!
Using Correlation For Inference
PEARSON’S r
Computation and Presentation
NONPARAMETRIC ALTERNATIVES
Spearman’s Rho and Kendall’s Tau
CORRELATION WITH THREE OR MORE VARIABLES
Partial r
Multiple R
Variations of Multiple R
OTHER MULTIVARIATE TESTS THAT USE CORRELATION
Factor Analysis
Cluster Analysis
CONCLUDING THOUGHTS
STUDY QUESTIONS
10 Regression Analyses
PREDICTION AND EVIDENCE BASED PRACTICE
PREDICTION AND STATISTICAL ANALYSIS
WHAT IS SIMPLE LINEAR REGRESSION?
Research Questions in Simple Linear Regression
Limitations of Simple Linear Regression
COMPUTATION OF THE REGRESSION EQUATION
MORE ABOUT THE REGRESSION LINE
The Least-Squares Criterion
Interchanging X and Y Variables
INTERPRETING RESULTS
Presentation of Y ?
The Standard Error
Using Regression in Social Work Practice
REGRESSION WITH THREE OR MORE VARIABLES
Options for Entering Variables
OTHER TYPES OF REGRESSION ANALYSES
Discriminant Analysis
Logistic Regression
CONCLUDING THOUGHTS
STUDY QUESTIONS
11Other Ways that Statistical Analyses Contribute to Evidence-Based Practice
META-ANALYSIS
ANSWERS SOUGHT IN PROGRAM EVALUATIONS
NEEDS ASSESSMENTS AND FORMATIVE EVALUATIONS
OUTCOME EVALUATIONS
Hypothesis Testing in Outcome Evaluations
Statistical Analyses of Outcome Evaluation Data
ANSWERS SOUGHT IN SINGLE-SYSTEM RESEARCH
Hypothesis Testing in Single-System Research
Statistical Analyses of Single-System Data
Using Familiar Statistical Tests
Two Other Popular Tests
CONCLUDING THOUGHTS
STUDY QUESTIONS
Appendix A Beginning to Select a Statistical Test
Glossary
Index
People also search:
statistics for social workers 8th edition pdf
statistics for social workers 8th edition
statistics for social workers 8th edition free pdf
statistics for social workers 8th edition download epub
statistics for social workers 8th edition free epub


