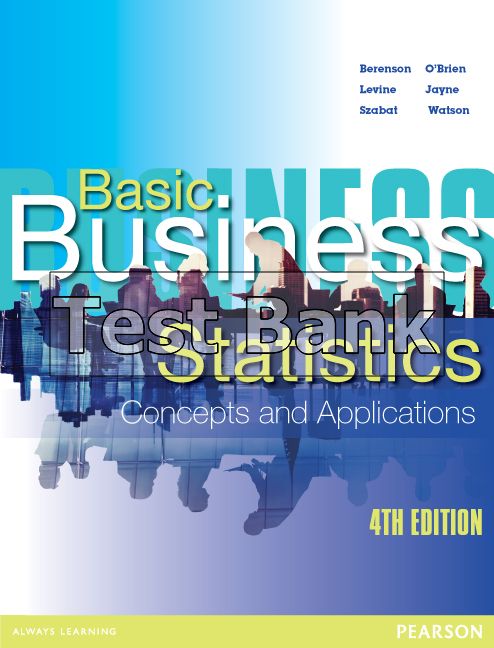
Basic Business Statistics Australian 4th Edition Berenson Test Bank
Roll over image to zoom in
$26.50$50.00 (-47%)
Basic Business Statistics Australian 4th Edition Berenson Test Bank.
You may also like
Basic Business Statistics Australian 4th Edition Berenson Test Bank
Product details:
Author: Mark Berenson; David Levine; Kathryn Szabat; Martin O’Brien; Judith Watson; Nicola Jayne
Student-friendly stats! Berensons clear and consistent explanations of how and why accepted statistical techniques are used and fresh, conversational writing style helps students with their comprehension of the concepts. Berensons real world business focus takes students beyond the pure theory by connecting statistical concepts to functional areas of business through engaging examples. Examples of real people working in real business environments, using statistics to tackle real business challenges bring the subject to life.
Table contents:
- Part 1: Presenting and Describing Information
- Chapter 1: Introduction and data collection
- 1.1: Basic concepts of statistics
- 1.2: The growth of statistics and information technology
- 1.3: Collecting data
- Identifying Sources of Data
- 1.4: Types of variables
- Levels of Measurement and Types of Measurement Scales
- Summary
- Key terms
- Chapter review problems
- Appendix 1: Introduction to using Microsoft Windows and Excel
- Chapter 2: Presenting data in tables and charts
- 2.1: Tables and charts for categorical data
- Summary Tables
- Bar Charts
- Pie Charts
- 2.2: Organising numerical data
- Ordered Arrays
- Stem-and-Leaf Displays
- 2.3: Tables and graphs for numerical data
- Frequency Distributions
- Relative Frequency Distributions and Percentage Distributions
- Cumulative Distributions
- Histograms
- Polygons
- Cumulative Percentage Polygons (Ogives)
- 2.4: Cross-tabulations
- Contingency Tables
- Side-by-Side Bar Charts
- 2.5: Scatter diagrams and time-series plots
- Scatter Diagrams
- Time-series Plots
- 2.6: Misusing graphs and ethical issues
- Ethical Concerns
- Summary
- Key terms
- Chapter review problems
- Appendix 2: Using statistical software for tables and charts
- Chapter 3: Numerical descriptive measures
- 3.1: Measures of central tendency, variation and shape
- Mean
- Median
- Mode
- Quartiles
- Geometric Mean
- Range
- Interquartile Range
- Variance and Standard Deviation
- Coefficient of Variation
- Z Scores
- Shape
- Microsoft Excel Descriptive Statistics Output
- 3.2: Numerical descriptive measures for a population
- Population Mean
- Population Variance and Standard Deviation
- The Empirical Rule
- The Chebyshev Rule
- 3.3: Calculating numerical descriptive measures from a frequency distribution
- 3.4: Five-number summary and box-and-whisker plots
- Five-Number Summary
- Box-and-Whisker Plots
- 3.5: Covariance and the coefficient of correlation
- Covariance
- Coefficient of Correlation
- 3.6: Pitfalls in numerical descriptive measures and ethical issues
- Ethical Issues
- Summary
- Key formulas
- Key terms
- Chapter review problems
- Appendix 3: Using statistical software for descriptive statistics
- End of Part 1 problems
- Part 2: Measuring Uncertainty
- Chapter 4: Basic probability
- 4.1: Basic probability concepts
- Events and Sample Spaces
- Contingency Tables and Venn Diagrams
- Marginal Probability
- Joint Probability
- General Addition Rule
- 4.2: Conditional probability
- Calculating Conditional Probabilities
- Decision Trees
- Statistical Independence
- Multiplication Rules
- Marginal Probability Using the General Multiplication Rule
- 4.3: Bayes’ theorem
- 4.4: Counting rules
- 4.5: Ethical issues and probability
- Summary
- Key formulas
- Key terms
- Chapter review problems
- Appendix 4: Using statistical software for basic probability
- Chapter 5: Some important discrete probability distributions
- 5.1: Probability distribution for a discrete random variable
- Expected Value of a Discrete Random Variable
- Variance and Standard Deviation of a Discrete Random Variable
- 5.2: Covariance and its application in finance
- Covariance
- Expected Value, Variance and Standard Deviation of the Sum of Two Random Variables
- Portfolio Expected Return and Portfolio Risk
- 5.3: Binomial distribution
- 5.4: Poisson distribution
- 5.5: Hypergeometric distribution
- 5.6: (Online Topic) Using the poisson distribution to approximate the binomial distribution
- Summary
- Key formulas
- Key terms
- Chapter review problems
- Appendix 5: Using statistical software for discrete probability distributions
- Chapter 6: The normal distribution and other continuous distributions
- 6.1: Continuous probability distributions
- 6.2: The normal distribution
- 6.3: Evaluating normality
- Evaluating the Properties
- Constructing a Normal Probability Plot
- 6.4: The uniform distribution
- 6.5: The exponential distribution
- 6.6: The normal approximation to the binomial distribution
- Need for a Continuity Correction
- Approximating the Binomial Distribution
- Calculating a Probability Approximation for an Individual Value
- Summary
- Key formulas
- Key terms
- Chapter review problems
- Appendix 6: Using statistical software for continuous probability distributions
- Chapter 7: Sampling distributions
- 7.1: Sampling distributions
- 7.2: Sampling distribution of the mean
- The Unbiased Property of the Sample Mean
- Standard Error of the Mean
- Sampling from Normally Distributed Populations
- Sampling from Non-normally Distributed Populations – The Central Limit Theorem
- 7.3: Sampling distribution of the proportion
- 7.4: Types of survey sampling methods
- Simple Random Sample
- Systematic Sample
- Stratified Sample
- Cluster Sample
- 7.5: Evaluating survey worthiness
- Survey Errors
- Ethical Issues
- Summary
- Key formulas
- Key terms
- Chapter review problems
- Appendix 7: Using statistical software for sampling distributions
- End of Part 2 problems
- Part 3: Drawing Conclusions about Populations Based only on Sample Information
- Chapter 8: Confidence interval estimation
- 8.1: Confidence interval estimation for the mean (σ known)
- 8.2: Confidence interval estimation for the mean (σ unknown)
- Student’s t Distribution
- Properties of the t Distribution
- The Concept of Degrees of Freedom
- The Confidence Interval Statement
- 8.3: Confidence interval estimation for the proportion
- 8.4: Determining sample size
- Sample Size Determination for the Mean
- Sample Size Determination for the Proportion
- 8.5: Applications of confidence interval estimation in auditing
- Estimating the Population Total Amount
- Difference Estimation
- One-Sided Confidence Interval Estimation of the Rate of Non-Compliance with Internal Controls
- 8.6: More on confidence interval estimation and ethical issues
- Summary
- Key formulas
- Key terms
- Chapter review problems
- Appendix 8: Using statistical software for confidence intervals and sample size determination
- Chapter 9: Fundamentals of hypothesis testing: One-sample tests
- 9.1: Hypothesis-testing methodology
- The Null and Alternative Hypotheses
- The Critical Value of the Test Statistic
- Regions of Rejection and Non-Rejection
- Risks in Decision Making Using Hypothesis Testing
- 9.2: Z test of hypothesis for the mean (σ known)
- The Critical Value Approach to Hypothesis Testing
- The p-Value Approach to Hypothesis Testing
- A Connection between Confidence Interval Estimation and Hypothesis Testing
- 9.3: One-tail tests
- The Critical Value Approach
- The p-Value Approach
- 9.4: t test of hypothesis for the mean (σ unknown)
- The Critical Value Approach
- The p-Value Approach
- Checking Assumptions
- 9.5: Z test of hypothesis for the proportion
- The Critical Value Approach
- The p-Value Approach
- 9.6: The power of a test
- 9.7: Potential hypothesis-testing pitfalls and ethical issues
- Data-Collection Method – Randomisation
- Informed Consent from the Human Respondents
- Type of Test: Two-Tail or One-Tail
- Choice of Level of Significance, ?
- Data Snooping
- Cleansing and Discarding of Data
- Reporting of Findings
- Statistical Significance Versus Practical Significance
- Summary
- Key formulas
- Key terms
- Chapter review problems
- Appendix 9: Using statistical software for one-sample tests of hypothesis
- Chapter 10: Hypothesis testing: Two-sample tests
People also search:
basic business statistics 5th edition answers
basic business statistics pearson
basic business statistics
business statistics 4th edition answers
global business 4th edition