Basic Business Statistics Concepts and Applications 5th Edition Berenson Solutions Manual
$26.50$50.00 (-47%)
Basic Business Statistics Concepts and Applications 5th Edition Berenson Solutions Manual.
You may also like
This is completed downloadable of Basic Business Statistics Concepts and Applications 5th Edition Berenson Solutions Manual
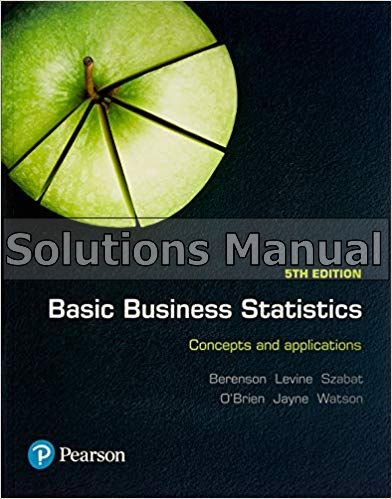
Product Details:
- ISBN-10 : 1488617244
- ISBN-13 : 978-1488617249
- Author:
The full text downloaded to your computer. With eBooks you can:
- search for key concepts, words and phrases
- make highlights and notes as you study
- share your notes with friends
- Print 5 pages at a time
- Compatible for PCs and MACs
- No expiry (offline access will remain whilst the Bookshelf software is installed.
eBooks are downloaded to your computer and accessible either offline through the VitalSource Bookshelf (available as a free download), available online and also via the iPad/Android app.
When the eBook is purchased, you will receive an email with your access code. Simply go to http://bookshelf.vitalsource.com/ to download the FREE Bookshelf software. After installation, enter your access code for your eBook.
Time limit
The VitalSource products do not have an expiry date. You will continue to access your VitalSource products whilst you have your VitalSource Bookshelf installed.
Table of Content:
- Part 1 Presenting and describing information
- Chapter 1 Defining and collecting data
- Learning objectives
- 1.1 Basic concepts of data and statistics
- The meaning of ‘data’
- The meaning of ‘statistics’
- Other important definitions
- 1.2 Types of variables
- Levels of measurement and types of measurement scales
- Learning objective 1
- Nominal and ordinal scales
- Interval and ratio scales
- 1.3 Collecting data
- Learning objective 2
- Identifying sources of data
- Learning objective 3
- ‘Big data’
- Data formatting
- Data cleaning
- Recoding variables
- 1.4 Types of survey sampling methods
- Learning objective 4
- Simple random sample
- Systematic sample
- Stratified sample
- Cluster sample
- 1.5 Evaluating survey worthiness
- Learning objective 5
- Survey errors
- Coverage error
- Non-response error
- Sampling error
- Measurement error
- Ethical issues
- 1.6 The growth of statistics and information technology
- 1 Assess your progress
- Summary
- Chapter review problems
- Checking your understanding
- Applying the concepts
- References
- Chapter 1 Excel guide
- EG1.1 Getting started with microsoft excel
- EG1.2 Opening and saving workbooks
- EG1.3 Entering data
- EG1.4 Using formulas in excel worksheets
- EG1.5 Creating charts
- EG1.6 Printing workbooks
- EG1.7 How using excel for mac differs
- EG1.8 Defining data
- Establishing the variable type
- EG1.9 COLLECTING DATA
- Recoding variables
- Key technique
- Example
- Excel how-to
- EG1.10 Types of sampling methods
- Simple random sample
- Key technique
- Example
- Excel how-to
- Analysis Toolpak
- Example
- PHStat
- Excel how-to
- Chapter 2 Organising and visualising data
- Learning objectives
- 2.1 Organising and visualising categorical data
- Learning objective 1
- Organising categorical data: Summary table
- Visualising categorical data: Bar charts
- Pie charts
- 2.2 Organising numerical data
- Learning objective 2
- Ordered arrays
- Stem-and-leaf displays
- 2.3 Summarising and visualising numerical data
- Learning objective 2
- Summarising numerical data: Frequency distributions
- Relative frequency and percentage distributions
- Cumulative distributions
- Histograms
- Polygons
- Cumulative percentage polygons (ogives)
- 2.4 Organising and visualising two categorical variables
- Learning objective 3
- Organising two categorical variables: Contingency tables
- Visualising two categorical variables: Side-by-side bar charts
- 2.5 Visualising two numerical variables
- Learning objective 4
- Scatter diagrams
- Time-series plots
- 2.6 Business analytics applications – descriptive analytics
- Learning objective 5
- Dashboards
- Data discovery
- 2.7 Misusing graphs and ethical issues
- Learning objective 6
- Ethical concerns
- 2 Assess your progress
- Summary
- Chapter review problems
- Checking your understanding
- Applying the concepts
- References
- Chapter 2 Excel guide
- EG2.1 Organising and visualising categorical data
- Organising categorical data
- The summary table
- Key technique
- Example
- PHStat
- In-depth excel (untallied data)
- In-depth excel (tallied data)
- Visualising categorical variables
- The bar chart and the pie chart
- Key technique
- Example
- PHStat
- In-depth excel
- EG2.2 Organising numerical data
- EG2.3 Summarising and visualising numerical data
- Summarising numerical data
- The frequency distribution
- Key technique
- Example
- Defining classes using bins
- PHStat (untallied data)
- In-depth excel (untallied data)
- Analysis toolpak (untallied data)
- The relative frequency, percentage and cumulative distributions
- Key technique
- Example
- PHStat (untallied data)
- In-depth excel (untallied data)
- Analysis toolpak
- Visualising numerical data
- The histogram
- Key technique
- Example
- PHStat
- PHStat defining classes bins and mid-points
- In-depth excel
- Analysis toolpak
- The percentage polygon and the cumulative percentage polygon (ogive)
- Key technique
- Example
- PHStat
- In-depth excel
- EG2.4 Organising and visualising two categorical variables
- Organising two categorical variables
- The contingency table
- Key technique
- Example
- PHStat (untallied data)
- In-depth excel (untallied data)
- In-depth excel (tallied data)
- Visualising two categorical variables
- The side-by-side chart
- Key technique
- Example
- PHStat
- In-depth excel
- EG2.5 Visualising two numerical variables
- EG2.6 Descriptive analytics
- Chapter 3 Numerical descriptive measures
- Learning objectives
- 3.1 Measures of central tendency, variation and shape
- Learning objective 1
- Measures of central tendency
- Mean
- Median
- Mode
- Quartiles
- Geometric mean
- Measures of variation
- Range
- Interquartile range
- Variance and standard deviation
- Coefficient of variation
- Z scores
- Shape
- Microsoft excel descriptive statistics output
- 3.2 Numerical descriptive measures for a population
- Learning objective 2
- Population mean
- Population variance and standard deviation
- The empirical rule
- The chebyshev rule
- 3.3 Calculating numerical descriptive measures from a frequency distribution
- Learning objective 1
- 3.4 Five-number summary and box-and-whisker plots
- Learning objective 3
- Five-number summary
- Box-and-whisker plots
- 3.5 Covariance and the coefficient of correlation
- Learning objective 4
- Covariance
- Coefficient of Correlation
- 3.6 Pitfalls in numerical descriptive measures and ethical issues
- Ethical issues
- 3 Assess your progress
- Summary
- Key formulas
- Chapter review problems
- Checking your understanding
- Applying the concepts
- Report writing exercise
- Chapter 3 Excel guide
- EG3.1 Measures of central tendency, variation and shape
- Central tendency
- The mean, median and mode
- Key technique
- Example
- PHStat
- In-depth excel
- Analysis Toolpak
- Quartiles
- Key technique
- Example
- PHStat
- In-depth excel
- The geometric mean
- Key technique
- Example
- In-depth excel
- Variation and shape
- The range
- Key technique
- Example
- PHStat
- In-depth excel
- Analysis Toolpak
- The interquartile range
- Key technique
- Example
- In-depth excel
- The variance, standard deviation, coefficient of variation and Z scores
- Key technique
- Example
- PHStat
- In-depth excel
- Analysis toolpak
- Shape: skewness and kurtosis
- Key technique
- Example
- PHStat
- In-depth excel
- Analysis toolpak
- EG3.2 Numerical descriptive measures for a population
- The population mean, population variance and population standard deviation
- Key technique
- Example
- In-depth excel
- The empirical rule and the chebyshev rule
- EG3.3 Five-number summary and box-and-whisker plots
- Key technique
- Example
- PHStat
- In-depth excel
- EG3.4 The covariance and the coefficient of correlation
- The covariance
- Key technique
- Example
- In-depth excel
- The coefficient of correlation
- Key technique
- Example
- In-depth excel
- End of part 1 problems
- Part 2 Measuring uncertainty
- Chapter 4 Basic probability
- Learning objective
- 4.1 Basic probability concepts
- Learning objective 1
- Events and sample spaces
- Contingency tables and venn diagrams
- Marginal probability
- Learning objective 2
- Joint probability
- General addition rule
- 4.2 Conditional probability
- Learning objective 3
- Calculating conditional probabilities
- Decision trees
- Statistical independence
- Multiplication rules
- Marginal probability using the general multiplication rule
- 4.3 Bayes’ theorem
- Learning objective 4
- 4.4 Counting rules
- Learning Objective 5
- 4.5 Ethical issues and probability
- 4 Assess your progress
- Summary
- Key formulas
- Chapter review problems
- Checking your understanding
- Applying the concepts
- Chapter 4 Excel guide
- EG4.1 Basic probability concepts
- Simple and Joint Probability and the General Addition Rule
- Key technique
- Example
- PHStat
- In-depth Excel
- EG4.2 Conditional Probability
- In-depth Excel
- EG4.3 Bayes’ theorem
- Key technique
- Example
- In-depth Excel
- EG4.4 Counting Rules
- Counting Rule 1
- In-depth Excel
- Counting Rule 2
- In-depth Excel
- Counting Rule 3
- In-depth Excel
- Counting Rule 4
- In-depth Excel
- Counting Rule 5
- In-depth Excel
- Chapter 5 Some important discrete probability distributions
- Learning objectives
- 5.1 Probability distribution for a discrete random variable
- Learning objectives 1
- Expected Value of a Discrete Random Variable
- Learning objectives 2
- Variance and Standard Deviation of a Discrete Random Variable
- 5.2 Covariance and its application in finance
- Learning objectives 3
- Covariance
- Expected Value, Variance and Standard Deviation of the Sum of Two Random Variables
- Portfolio Expected Return and Portfolio Risk
- 5.3 Binomial distribution
- Learning objectives 4
- 5.4 Poisson distribution
- Learning objectives 5
- 5.5 Hypergeometric distribution
- Learning objectives 6
- 5 Assess your progress
- Summary
- Key formulas
- Chapter review problems
- Checking your understanding
- Applying the concepts
- Chapter 5 Excel guide
- EG5.1 The probability distribution for a discrete variable
- Key technique
- Example
- In-depth excel
- EG5.2 Covariance of a probability distribution and its application in finance
- Key technique
- Example
- PHStat
- In-depth excel
- EG5.3 Binomial distribution
- Key technique
- Example
- PHStat
- In-depth Excel
- EG5.4 Poisson distribution
- Key technique
- Example
- PHStat
- In-depth Excel
- EG5.5 Hypgeometric distribution
- Key technique
- Example
- PHStat
- In-depth Excel
- Chapter 6 The normal distribution and other continuous distributions
- Learning objectives
- 6.1 Continuous probability distributions
- 6.2 The normal distribution
- Learning objective 1
- 6.3 Evaluating normality
- Learning objective 2
- Evaluating the properties
- Constructing a normal probability plot
- 6.4 The uniform distribution
- Learning objective 3
- 6.5 The exponential distribution
- Learning objective 4
- 6.6 The normal approximation to the binomial distribution
- Learning objective 5
- Need for a continuity correction
- Approximating the binomial distribution
- Calculating a probability approximation for an individual value
- 6 Assess your progress
- Summary
- Key formulas
- Chapter review problems
- Checking your understanding
- Applying the concepts
- Chapter 6 Excel guide
- EG6.1 Continuous probability distributions
- EG6.2 The Normal Distribution
- Key technique
- Example
- PHStat
- In-depth excel
- EG6.3 Evaluating normality
- Comparing Data Characteristics to Theoretical Properties
- Constructing the normal probability plot
- Key technique
- Example
- PHStat
- In-depth excel
- EG6.4 The uniform distribution
- EG6.5 The exponential distribution
- Key technique
- Example
- PHStat
- In-depth excel
- Chapter 7 Sampling distributions
- Learning objectives
- 7.1 Sampling distributions
- Learning objective 1
- 7.2 Sampling distribution of the mean
- The unbiased property of the sample mean
- Standard Error of the Mean
- Sampling from normally distributed populations
- Learning objective 2
- Sampling from non-normally distributed populations – the central limit theorem
- Learning objective 3
- 7.3 Sampling distribution of the proportion
- Learning objective 4
- 7 Assess your progress
- Summary
- Key formulas
- References
- Chapter review problems
- Checking your understanding
- Applying the concepts
- Chapter 7 Excel guide
- EG7.1 Sampling distribution of the mean
- Key technique
- Example
- Analysis ToolPak
- EG7.2 Central limit theorem
- End of part 2 problems
- Part 3 Drawing conclusions about populations based only on sample information
- Chapter 8 Confidence interval estimation
- Learning objectives
- 8.1 Confidence interval estimation for the mean (σ known)
- Learning objective 1
- 8.2 Confidence interval estimation for the mean (σ unknown)
- Student’s t distribution
- Properties of the t distribution
- The concept of degrees of freedom
- The confidence interval statement
- Learning objective 1
- 8.3 Confidence interval estimation for the proportion
- Learning objective 2
- 8.4 Determining sample size
- Learning objective 3
- Sample size determination for the mean
- Sample size determination for the proportion
- Learning objective 3
- 8.5 Applications of confidence interval estimation in auditing
- Estimating the population total amount
- Learning objective 4
- Difference estimation
- One-Sided confidence interval estimation of the rate of non-compliance with internal controls
- Learning objective 4
- 8.6 More on confidence interval estimation and ethical issues
- 8 Assess your progress
- Summary
- Key formulas
- References
- Chapter review problems
- Checking your understanding
- Applying the concepts
- Report writing exercise
- Chapter 8 Excel guide
- EG8.1 Confidence interval estimate for the mean (σ known)
- EG8.2 Confidence interval estimate for the mean (σ unknown)
- EG8.3 Confidence interval estimate for the proportion
- EG8.4 Sample size determination for the mean
- EG8.5 Sample size determination for the proportion
- EG8.6 Confidence interval estimate for the population total
- EG8.7 Confidence interval estimate for the total difference
- Chapter 9 Fundamentals of hypothesis testing: One-sample tests
- Learning objectives
- 9.1 Hypothesis-testing methodology
- The null and alternative hypotheses
- Learning objective 1
- Determining the test statistic
- Regions of rejection and non-rejection
- Risks in decision making using hypothesis testing
- The level of significance (α)
- The confidence coefficient
- The risk of type II error (β)
- Learning objective 2
- The power of a test
- Risks in decision making: A delicate balance
- 9.2 Z test of hypothesis for the mean (σ known)
- Learning objective 2
- Learning objective 3
- The critical value approach to hypothesis testing
- The p-value approach to hypothesis testing
- A connection between confidence interval estimation and hypothesis testing
- 9.3 One-tail tests
- Learning objective 2
- The critical value approach
- The p-value approach
- Learning objective 1
- 9.4 t Test of hypothesis for the mean (σ unknown)
- The critical value approach
- Learning objective 2
- The p-value approach
- Checking assumptions
- Learning objective 2
- 9.5 Z test of hypothesis for the proportion
- Learning objective 3
- The critical value approach
- The p-value approach
- 9.6 The power of a test
- Learning objective 2
- 9.7 Potential hypothesis-testing pitfalls and ethical issues
- Learning objective 4
- Data-collection method – randomisation
- Learning objective 5
- Informed consent from human respondents
- Type of test: Two-tail or one-tail
- Choice of level of significance, ?
- Data snooping
- Cleansing and discarding of data
- Reporting of findings
- Statistical significance versus practical significance
- Statistical insignificance versus importance
- 9 Assess your progress
- Summary
- Key formulas
- References
- Chapter review problems
- Checking your understanding
- Applying the concepts
- Report writing exercise
- Chapter 9 Excel guide
- EG9.1 Z test for the mean, σ known
- EG9.2 t test for the mean, σ unknown
- EG9.3 Z test for the proportion
- Chapter 10 Hypothesis testing: two-sample tests
- Learning objectives
- 10.1 Comparing the means of two independent populations
- Learning objective 1
- Z test for the difference between two means
- Pooled-variance t test for the difference between two means
- Confidence interval estimate for the difference between the means of two independent populations
- Separate-variance t test for the difference between two means
- 10.2 Comparing the means of two related populations
- Learning objective 2
- Paired t test
- Confidence interval estimate for the mean difference
- 10.3 F test for the difference between two variances
- Learning objective 3
- Finding lower-tail critical values
- 10.4 Comparing two population proportions
- Learning objective 4
- Z test for the difference between two proportions
- Confidence interval estimate for the difference between two proportions
- 10 Assess your progress
- Summary
- Key formulas
- Chapter review problems
- Checking your understanding
- Applying the concepts
- Report writing exercise
- References
- Chapter 10 Excel guide
- EG10.1 Comparing the means of two independent populations
- Pooled-variance t test for the difference between two means
- Key technique
- Example
- PHStat
- Analysis ToolPak
- Confidence interval estimate for the difference between two means
- PHStat
- t test for the difference between two means, assuming unequal variances
- Key technique
- Example
- PHStat
- Analysis ToolPak
- EG10.2 Comparing the means of two related populations
- Paired t test
- Key technique
- Example
- PHStat
- Analysis ToolPak
- EG10.3 f test for the difference between two variances
- Key technique
- Example
- PHStat
- Analysis ToolPak
- EG10.4 Comparing the proportions of two independent populations
- Z test for the difference between two proportions
- Key technique
- Example
- PHStat
- Confidence interval estimate for the difference between two proportions
- PHStat
- Chapter 11 Analysis of variance
- Learning objectives
- 11.1 The completely randomised design: One-way analysis of variance
- Learning objective 1
- Learning objective 2
- F test for differences between more than two means
- Multiple comparisons: the tukey–kramer procedure
- ANOVA Assumptions
- The levene test for homogeneity of variance
- 11.2 The randomised block design
- Learning objective 3
- Tests for the treatment and block effects
- Multiple comparisons: The tukey procedure
- 11.3 The factorial design: Two-way analysis of variance
- Learning objective 4
- Testing for factor and interaction effects
- Interpreting interaction effects
- Multiple comparisons: The tukey procedure
- 11 Assess your progress
- Summary
- Key formulas
- Chapter review problems
- Checking your understanding
- Applying the concepts
- Report writing exercise
- References
- Chapter 11 Excel guide
- EG11.1 The completely randomised design: One-way ANOVA
- Analysing variation in one-way ANOVA
- Key technique
- F test for differences among more than two means
- Key technique
- Example
- PHStat
- Analysis ToolPak
- Multiple comparisons: The tukey–kramer procedure
- Key technique
- Example
- PHStat
- Analysis ToolPak
- Levene test for homogeneity of variance
- Key technique
- Example
- PHStat
- Analysis ToolPak
- EG11.2 The randomised block design
- Key technique
- Example
- PHStat
- Analysis ToolPak
- EG11.3 The factorial design: Two-way ANOVA
- Key technique
- Example
- PHStat
- Analysis ToolPak
- Visualising interaction effects: The cell means plot
- Key technique
- Example
- PHStat
- End of part 3 problems
- Part 4 Determining cause and making reliable forecasts
- Chapter 12 Simple linear regression
- Learning objectives
- 12.1 Types of regression models
- Learning objective 1
- 12.2 Determining the simple linear regression equation
- The least-squares method
- 12.3 Measures of variation
- Calculating the sum of squares
- The coefficient of determination
- Learning objective 3
- Standard error of the estimate
- 12.4 Assumptions
- Learning objective 4
- 12.5 Residual analysis
- Evaluating the assumptions
- Linearity
- Independence
- Normality
- Equal variance
- 12.6 Measuring autocorrelation – The Durbin–Watson statistic
- Learning objective 4
- Residual plots to detect autocorrelation
- The durbin-watson statistic
- 12.7 Inferences about the slope and correlation coefficient
- t test for the slope
- Learning objective 5
- F Test for the slope
- Confidence interval estimate of the slope (β1)
- t test for the correlation coefficient
- Learning objective 6
- 12.8 Estimation of mean values and prediction of individual values
- Learning objectives 7
- The confidence interval estimate
- The prediction interval
- 12.9 Pitfalls in regression and ethical issues
- Learning objective 8
- 12 Assess your progress
- Summary
- Key formulas
- Chapter review problems
- Checking your understanding
- Applying the concepts
- References
- Chapter 12 Excel guide
- EG12.1 Types of regression models
- EG12.2 Determining the simple linear regression equation
- Key technique
- Example
- PHStat
- Analysis ToolPak
- EG12.3 Measures of variation
- EG12.4 Assumptions of regression
- EG12.5 Residual analysis
- Key technique
- Example
- PHStat
- Analysis ToolPak
- EG12.6 Measuring autocorrelation: The durbin-watson statistic
- Key technique
- Example
- PHStat
- EG12.7 Inferences about the slope and correlation coefficient
- EG12.8 Estimation of mean values and prediction of individual values
- Key technique
- Example
- PHStat
- Chapter 13 Introduction to multiple regression
- Learning objectives
- 13.1 Developing the multiple regression model
- Learning objective 1
- Interpreting the regression coefficients
- Predicting the dependent variable, Y
- 13.2 R2, adjusted R2 and the overall F test
- Coefficients of multiple determination
- Test for the significance of the overall multiple regression model
- 13.3 Residual analysis for the multiple regression model
- Learning objective 1
- 13.4 Inferences concerning the population regression coefficients
- Learning objective 2
- Tests of hypothesis
- Confidence interval estimation
- 13.5 Testing portions of the multiple regression model
- Learning objective 2
- Coefficients of partial determination
- 13.6 Using dummy variables and interaction terms in regression models
- Learning objectives 3
- Interactions
- 13.7 Collinearity
- Learning objective 4
- 13 Assess your progress
- Summary
- Key formulas
- Chapter review problems
- Checking your understanding
- Applying the concepts
- References
- Chapter 13 Excel guide
- EG13.1 Developing a multiple regression model
- Interpreting the regression coefficients
- Key technique
- Example
- PHStat
- Analysis toolpak
- Predicting the dependent variable Y
- Key technique
- Example
- PHStat
- EG13.2 r2, adjusted r2 and the overall F test
- EG13.3 Residual analysis for the multiple regression model
- Key technique
- Example
- PHStat
- Analysis toolpak
- EG13.4 Inferences concerning the population regression coefficients
- EG13.5 Testing portions of the multiple regression model
- Key technique
- Example
- PHStat
- Chapter 14 Time-series forecasting and index numbers
- Learning objectives
- 14.1 The importance of business forecasting
- Learning objective 1
- 14.2 Component factors of the classical multiplicative time-series model
- Learning objective 2
- 14.3 Smoothing the annual time series
- Learning objective 3
- Moving averages
- Exponential smoothing
- 14.4 Least-squares trend fitting and forecasting
- Learning objective 4
- Linear trend model
- Quadratic trend model
- Exponential trend model
- Model selection using first, second and percentage differences
- Applying the concepts
- 14.5 The holt–winters method for trend fitting and forecasting
- Learning objective 5
- Applying the concepts
- 14.6 Autoregressive modelling for trend fitting and forecasting
- Learning objective 6
- Second-order autoregressive model
- 14.7 Choosing an appropriate forecasting model
- Learning objective 7
- Performing a residual analysis
- Measuring the magnitude of the residual error with squared or absolute differences
- Principle of parsimony
- Comparison of five forecasting methods
- 14.8 Time-series forecasting of seasonal data
- Learning objective 8
- Least-squares forecasting with monthly or quarterly data
- 14.9 Index numbers
- Learning objective 9
- The price index
- Aggregate price indices
- Weighted aggregate price indices
- Laspeyres price index
- Paasche price index
- Some common price indices
- 14.10 Pitfalls in Time-series Forecasting
- 14 Assess your progress
- Summary
- Key formulas
- Chapter review problems
- Checking your understanding
- Applying the concepts
- References
- Chapter 14 Excel guide
- EG14.1 The importance of business forecasting
- EG14.2 Component factors of time-series models
- EG14.3 Smoothing an annual time series
- Moving averages
- Key technique
- Example
- Exponential smoothing
- Key technique
- Example
- Analysis ToolPak
- EG14.4 Least-squares trend fitting and forecasting
- The linear trend model
- The quadratic trend model
- The exponential trend model
- Key technique
- Model selection using first, second, and percentage differences
- EG14.5 Autoregressive modelling for trend fitting and forecasting
- Creating lagged predictor variables
- Autoregressive modelling
- EG14.6 Choosing an appropriate forecasting model
- Performing a residual analysis
- Measuring the magnitude of the residuals through squared or absolute differences
- A comparison of five forecasting methods
- EG14.7 Time-series forecasting of seasonal data
- Least-squares forecasting with monthly or quarterly data
- Chapter 15 Chi-square tests
- Learning objectives
- 15.1 Chi-square test for the difference between two proportions (independent samples)
- Learning objective 1
- 15.2 Chi-Square test for differences between more than two proportions
- The marascuilo procedure
- Learning objective 2
- 15.3 Chi-Square test of independence
- Learning objective 3
- 15.4 Chi-Square goodness-of-fit tests
- Learning objective 4
- Chi-Square goodness-of-fit test for a poisson distribution
- Chi-Square goodness-of-fit test for a normal distribution
- 15.5 Chi-Square test for a variance or standard deviation
- Learning objective 5
- 15 Assess your progress
- Summary
- Key formulas
- Chapter review problems
- Checking your understanding
- Applying the concepts
- Team project
- References
- Chapter 15 Excel guide
- EG15.1 For χ2 test for the difference between two proportions
- EG15.2 For χ2 test for the differences in more than two proportions and for the χ2 test of independence
- End of Part 4 problems
- Part 5 Further topics in stats
- Chapter 16 Multiple regression model building
- Learning objectives
- 16.1 Quadratic regression model
- Learning objectives 1
- Finding the regression coefficients and predicting Y
- Testing for the significance of the quadratic model
- Testing the quadratic effect
- The coefficient of multiple determination
- 16.2 Using transformations in regression models
- Learning objectives 2
- The square-root transformation
- The log transformation
- 16.3 Influence analysis
- Learning objectives 3
- The hat matrix elements hi
- The studentised deleted residuals ti
- Cook’s distance statistic Di
- Overview
- 16.4 Model building
- Learning objectives 4
- The stepwise regression approach to model building
- The best-subsets approach to model building
- Model validation
- 16.5 Pitfalls in multiple regression and ethical issues
- Learning objectives 5
- Pitfalls in multiple regression
- Ethical considerations
- 16 Assess your progress
- Summary
- Key formulas
- Chapter review problems
- Checking your understanding
- Applying the concepts
- References
- Chapter 6 Excel guide
- EG16.1 The quadratic regression model
- Key technique
- Example
- EG16.2 Using transformations in regression models
- The square-root transformation
- The log transformation
- EG16.3 Collinearity
- PHStat
- EG16.4 Model building
- The stepwise regression approach to model building
- Key technique
- Example
- PHStat
- The best-subsets approach to model building
- Key technique
- Example
- PHStat
- Chapter 17 Decision making
- Learning objectives
- 17.1 Payoff tables and decision trees
- Learning objectives 1
- 17.2 Criteria for decision making
- Learning objectives 2
- Expected monetary value
- Expected opportunity loss
- Return-to-risk ratio
- 17.3 Decision making with sample information
- Learning objectives 2
- 17.4 Utility
- Learning objectives 4
- 17 Assess your progress
- Summary
- Key formulas
- Chapter review problems
- Checking your understanding
- Applying the concepts
- References
- Chapter 17 Excel guide
- EG17.1 Opportunity loss
- EG17.2 Expected monetary value
- EG17.3 Expected opportunity loss
- Chapter 18 Statistical applications in quality management
- Learning objectives
- 18.1 Total quality management
- 18.2 Six sigma management
- The DMAIC model
- 18.3 The theory of control charts
- Learning objectives 1
- 18.4 Control chart for the proportion — The p chart
- Learning objectives 2
- Learning objectives 3
- 18.5 The red bead experiment — understanding process variability
- Learning objectives 1
- 18.6 Control chart for an area of opportunity — the c chart
- Learning objectives 2
- Learning objectives 3
- 18.7 Control charts for the range and the mean
- Learning objectives 2
- Learning objectives 3
- The R chart
- The X¯ Chart
- 18.8 Process capability
- Learning objectives 4
- Customer satisfaction and specification limits
- Capability indices
- CPL, CPU and Cpk
- 18 Assess your progress
- Summary
- Key formulas
- Chapter review problems
- Checking your understanding
- Applying the concepts
- References
- Chapter 18 Excel guide
- EG18.1 Total quality management
- EG18.2 Six sigma management
- EG18.3 The theory of control charts
- EG18.4 Control chart for the proportion: the p chart
- Example
- PHStat
- In-depth excel
- EG18.5 The red bead experiment: understanding process variability
- EG18.6 Control chart for an area of opportunity: the c chart
- Example
- PHStat
- In-depth excel
- EG18.7 Control charts for the range and the mean
- The R Chart and the X¯ chart
- Example
- PHStat
- In-depth excel
- EG18.8 Process capability
- Chapter 19 Further non-parametric tests
- Learning objectives
- 19.1 McNemar test for the difference between two proportions (related samples)
- Learning objectives 1
- 19.2 Wilcoxon rank sum test — non-parametric analysis for two independent populations
- 19.3 Wilcoxon signed ranks test — non-parametric analysis for two related populations
- 19.4 Kruskal—Wallis rank test — non-parametric analysis for the one-way anova
- 19.5 Friedman rank test — non-parametric analysis for the randomised block design
- 19 Assess your progress
- Summary
- Key formulas
- Chapter review problems
- Checking your understanding
- Chapter 19 Excel guide
- EG19.1 McNemar test for the difference between two proportions (related samples)
- Key technique
- Example
- PHStat
- In-depth excel
- EG19.2 Wilcoxon rank sum test: non-parametric analysis for two independent populations
- Key technique
- Example
- PHStat
- In-depth excel
- EG19.3 Wilcoxon signed ranks test: non-parametric analysis for two related populations
- Key technique
- Example
- PHStat
- In-depth excel
- EG19.4 Kruskal—wallis rank test: non-parametric analysis for the one-way anova
- Key technique
- Example
- PHStat
- In-depth excel
- EG19.5 Friedman rank test: non-parametric analysis for the randomised block design
- Key technique
- Example
- PHStat
- In-depth excel
- Chapter 20 Business analytics
- Learning objectives
- 20.1 Predictive analytics
- Learning objective 1
- 20.2 Classification and regression trees
- Learning objective 1
- Regression tree example
- 20.3 Neural networks
- Learning objective 2
- Multilayer perceptrons
- 20.4 Cluster analysis
- Learning objective 3
- 20.5 Multidimensional scaling
- Learning objective 4
- 20 Assess your progress
- Summary
- Key formulas
- Chapter review problems
- Checking your understanding
- Applying the concepts
- References
- Chapter 20 Software guide
- Introduction
- Jmp
- Tableau public
- Data Discovery
- In-depth Excel
- JMP
- SG20.1 Predictive analytics
- SG20.2 Classification and regression trees
- Classification Tree
- JMP
- Regression Tree
- JMP
- SG20.3 Neural networks
- JMP
- SG20.4 Cluster analysis
- JMP 10
- SG20.5 Multidimensional scaling
- JMP
- Chapter 21 Data analysis: the big picture
- Learning objectives
- 21.1 Analysing numerical variables
- Learning objectives 1
- Learning objectives 2
- Describing the characteristics of a numerical variable
- Reaching conclusions about the population mean and/or standard deviation
- Determining whether the mean and/or standard deviation differs depending on the group
- If the grouping variable defines two independent groups and you are interested in central tendency
- If the grouping variable defines two groups of matched samples or repeated measurements and you are interested in central tendency
- If the grouping variable defines two independent groups and you are interested in variability
- If the grouping variable defines more than two independent groups and you are interested in central tendency
- If the grouping variable defines more than two groups of matched samples or repeated measurements and you are interested in central tendency
- Determining which factors affect the value of a variable
- Predicting the value of a variable based on the values of other variables
- Determining whether the values of a variable are stable over time
- 21.2 Analysing categorical variables
- Learning objectives 1
- Describing the proportion of items of interest in each category
- Reaching conclusions about the proportion of items of interest
- Determining whether the proportion of items of interest differs depending on the group
- For two categories and two independent groups
- For two categories and two groups of matched or repeated measurements
- For two categories and more than two independent groups
- For more than two categories and more than two groups
- Determining whether the proportion of items of interest is stable over time
- 21.3 Predictive analytics
- Learning objectives 2
- 21 Assess your progress
- Chapter review problems
- End of part 5 problems
- Appendices
- A Review of arithmetic, algebra and logarithms
- A.1 Rules for arithmetic operations
- A.2 Rules for algebra: Exponents and square roots
- A.3 Rules for logarithms
- Base 10
- Solution
- Base e
- Solution
- B Summation Notation
- Problem
- Answer
- References
- C Statistical Symbols and Greek Alphabet
- C.1 Statistical Symbols
- C.2 Greek Alphabet
- D PHStat User’s Guide
- About this appendix
- D.1 Sampling distributions simulation
- D.2 Confidence interval estimate for the mean, sigma known
- D.3 Confidence interval estimate for the mean, sigma unknown
- D.4 Confidence interval estimate for the proportion
- D.5 Sample size determination for the mean
- D.6 Sample size determination for the proportion
- D.7 Confidence interval estimate for the population total
- D.8 Confidence interval estimate for the total difference
- D.9 Z Test for the mean, sigma known
- D.10 t Test for the mean, sigma unknown
- D.11 Z Test for the proportion
- D.12 Chi-square test for differences in two proportions
- D.13 Chi-square test
- D.14 Opportunity loss
- D.15 Expected opportunity loss
- D.16 Expected monetary value
- E Tables
- F Using Microsoft Excel Analysis ToolPak
- F.1 Configuring microsoft excel
- F.2 Using the data analysis tools
- Glossary
People Also Search:
basic business statistics concepts and applications berenson
basic business statistics concepts and applications 5th edition berenson
basic business statistics concepts and applications
basic business statistics concepts and applications 5th edition download scribd
basic business statistics concepts and applications 5th edition
basic business statistics concepts and applications 5th edition solution manual download pdf

