
Business Statistics 10th Edition Groebner Solutions Manual

You may also like


This is completed downloadable of Business Statistics 10th Edition Groebner Solutions Manual
Product Details:
- ISBN-10 : 9780134496498
- ISBN-13 : 978-0134496498
- Author:
Business Statistics: A Decision Making Approachprovides you with an introduction to business statistics and to the analysis skills and techniques needed to make successful real-world business decisions. Written for students of all mathematical skill levels, the authors present concepts in a systematic and ordered way, drawing from their own experience as educators and consultants. Rooted in the theme that data are the starting point, Business Statistics champions the need to use and understand different types of data and data sources to be effective decision makers. This new edition integrates Microsoft Excel throughout as a way to work with statistical concepts and gives you a resource that can be used in both their academic and professional careers.
Table of Content:
Chapter 1:
Business statistics are of two types – descriptive statistics and inference statistics. As the name suggests, descriptive statistics are designed to describe data. Some examples of descriptive statistics include are charts, graphs, tables and so on. Inferential statistics, on the other hand, use data to predict or infer trends, preferences, etc. and to make decisions.
“The manager of Anna’s Fabric Shop has collected data for 10 years on the number of each type of dress fabric that has been sold at the store”
From the given information the manager has collected data for 10 years on the number of each type of dress fabric that has been sold at the store, her presentation would be primarily descriptive, and she would use charts, graphs, tables and other such numerical measures to present the data.
The given data represents the downtime on one of the client’s primary network servers.
1)
Construct a frequency distribution for the downtime data.
For the given data the frequency distribution table is as shown below:
| Problem Experienced | Frequency |
| Lockups | 6 |
| Manual Re-start | 1 |
| Memory Errors | 10 |
| Slow Startup | 1 |
| Weekly Virus Scan | 4 |
| Total | 22 |
From the above plot it is clear that, memory errors occur more frequently.
2)
Construct the bar chart for the frequency distribution.
Use Excel to get the required plot as shown below:
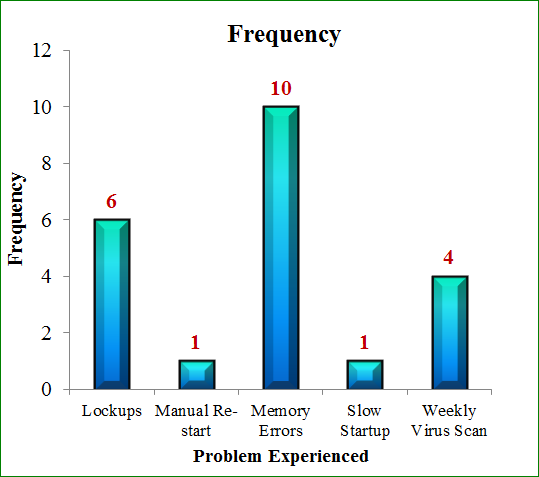
From the above plot it is clear that, the long bar which relates to memory errors occur more frequently.
3)
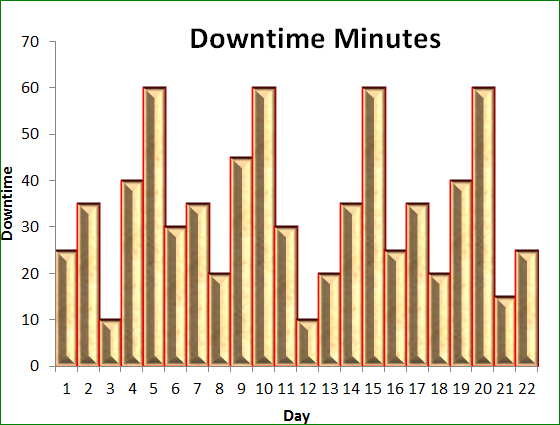
Construct a histogram that displays the downtime data.
Use Excel to get the required plot as shown below:
 j
j
Form the above plot it is clear that maximum downtime is 60 minutes.
4)
Construct the Pie chart.
Use Excel to get the required plot as shown below:
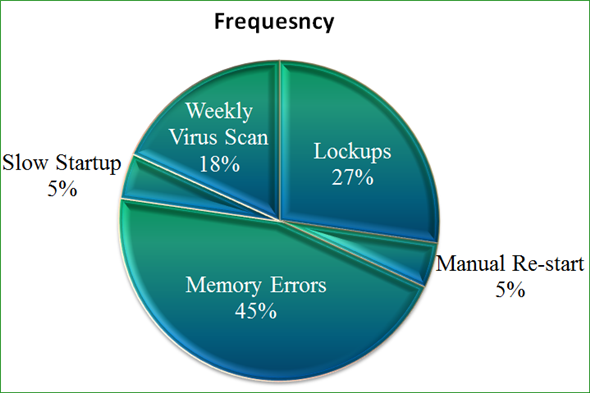
From the above plot it is clear that about 45% downtimes caused by the memory errors.
4)
By observing all the above plots we can summarize that memory errors causes more portion of the downtimes. Nearly it takes 45% of the downtime caused by the memory errors, 27% downtimes caused by lockups, 18% by weekly virus scan and 5% by slow start up and manual re-start each.
People Also Search:
business statistics groebner
business statistics 10th edition groebner
business statistics
business statistics 10th edition
business statistics 10th edition solution manual download pdf
business statistics 10th edition download scribd