- View cart You cannot add another "3rd Your UNIX Linux The Ultimate Guide Edition Sumitabha Das Solutions Manual" to your cart.
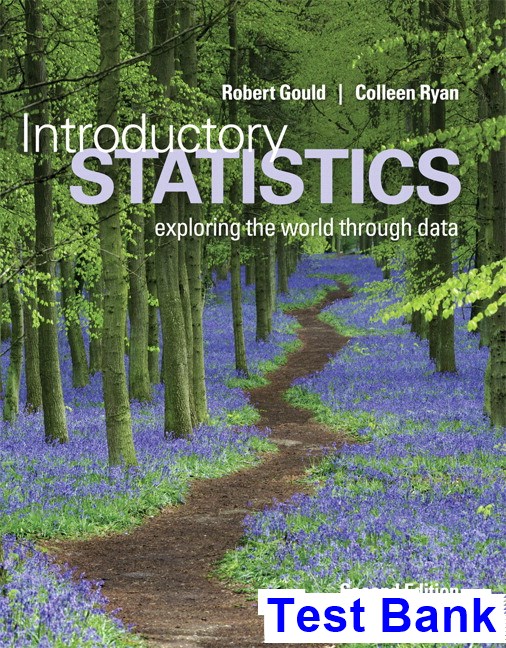
Introductory Statistics 2nd Edition Gould Test Bank
You may also like
-
$26.99
$50.00
Instant download Introductory Statistics 2nd Edition Gould Test Bank pdf docx epub after payment.
Product details:
- ISBN-10 : 0321978277
- ISBN-13 : 978-0321978271
- Author:
NOTE: Before purchasing, check with your instructor to ensure you select the correct ISBN. Several versions of Pearson’s MyLab & Mastering products exist for each title, and registrations are not transferable. To register for and use Pearson’s MyLab & Mastering products, you may also need a Course ID, which your instructor will provide.
Table of contents:
1. Introduction to Data
Case Study: Deadly Cell Phones?
1.1 What Are Data?
1.2 Classifying and Storing Data
1.3 Organizing Categorical Data
1.4 Collecting Data to Understand Causality
Exploring Statistics: Collecting a Table of Different Kinds of Data
2. Picturing Variation with Graphs
Case Study: Student-to-Teacher Ratio at Colleges
2.1 Visualizing Variation in Numerical Data
2.2 Summarizing Important Features of a Numerical Distribution
2.3 Visualizing Variation in Categorical Variables
2.4 Summarizing Categorical Distributions
2.5 Interpreting Graphs
Exploring Statistics: Personal Distance
3. Numerical Summaries of Center and Variation
Case Study: Living in a Risky World
3.1 Summaries for Symmetric Distributions
3.2 What’s Unusual? The Empirical Rule and z-Scores
3.3 Summaries for Skewed Distributions
3.4 Comparing Measures of Center
3.5 Using Boxplots for Displaying Summaries
Exploring Statistics: Does Reaction Distance Depend on Gender?
4. Regression Analysis: Exploring Associations between Variables
Case Study: Catching Meter Thieves
4.1 Visualizing Variability with a Scatterplot
4.2 Measuring Strength of Association with Correlation
4.3 Modeling Linear Trends
4.4 Evaluating the Linear Model
Exploring Statistics: Guessing the Age of Famous People
5. Modeling Variation with Probability
Case Study: SIDS or Murder?
5.1 What Is Randomness?
5.2 Finding Theoretical Probabilities
5.3 Associations in Categorical Variables
5.4 Finding Empirical Probabilities
Exploring Statistics: Let’s Make a Deal: Stay or Switch?
6. Modeling Random Events: The Normal and Binomial Models
Case Study: You Sometimes Get More Than You Pay For
6.1 Probability Distributions Are Models of Random Experiments
6.2 The Normal Model
6.3 The Binomial Model (Optional)
Exploring Statistics: ESP with Coin Flipping
7. Survey Sampling and Inference
Case Study: Spring Break Fever: Just What the Doctors Ordered? 30
7.1 Learning about the World through Surveys
7.2 Measuring the Quality of a Survey
7.3 The Central Limit Theorem for Sample Proportions
7.4 Estimating the Population Proportion with Confidence Intervals
7.5 Comparing Two Population Proportions with Confidence
Exploring Statistics: Simple Random Sampling Prevents Bias
8. Hypothesis Testing for Population Proportions
Case Study: Dodging the Question
8.1 The Essential Ingredients of Hypothesis Testing
8.2 Hypothesis Testing in Four Steps
8.3 Hypothesis Tests in Detail
8.4 Comparing Proportions from Two Populations
Exploring Statistics: Identifying Flavors of Gum through Smell
9. Inferring Population Means
Case Study: Epilepsy Drugs and Children
9.1 Sample Means of Random Samples
9.2 The Central Limit Theorem for Sample Means
9.3 Answering Questions about the Mean of a Population
9.4 Hypothesis Testing for Means
9.5 Comparing Two Population Means
9.6 Overview of Analyzing Means
Exploring Statistics: Pulse Rates
10. Associations between Categorical Variables
Case Study: Popping Better Popcorn
10.1 The Basic Ingredients for Testing with Categorical Variables
10.2 The Chi-Square Test for Goodness of Fit
10.3 Chi-Square Tests for Associations between Categorical Variables
10.4 Hypothesis Tests When Sample Sizes Are Small
Exploring Statistics: Skittles
11. Multiple Comparisons and Analysis of Variance
Case Study: Seeing Red
11.1 Multiple Comparisons
11.2 The Analysis of Variance
11.3 The ANOVA Test
11.4 Post-Hoc Procedures
Exploring Statistics: Recovery Heart Rate
12. Experimental Design: Controlling Variation
Case Study: Does Stretching Improve Athletic Performance?
12.1 Variation Out of Control
12.2 Controlling Variation in Surveys
12.3 Reading Research Papers
Exploring Statistics: Reporting on Research Abstracts
13. Inference without Normality
Case Study: Contagious Yawns
13.1 Transforming Data
13.2 The Sign Test for Paired Data
13.3 Mann-Whitney Test for Two Independent Groups
13.4 Randomization Tests
Exploring Statistics: Balancing on One Foot
14. Inference for Regression
Case Study: Building a Better Oyster Shucker
14.1 The Linear Regression Model
14.2 Using the Linear Model
14.3 Predicting Values and Estimating Means
Exploring Statistics: Older and Slower?
People Also Search:
openstax introductory statistics
what is introduction to statistics
introductory statistics and analytics a resampling perspective pdf
a survey of an introductory statistics class in autumn
a distribution of grades in an introductory statistics class
a pathway to introductory statistics chegg
best introductory statistics course
introductory business statistics
in a large introductory statistics class the distribution


