Macroeconomics 10th Edition Parkin Test Bank
You may also like


This is completed downloadable of Macroeconomics 10th Edition Parkin Test Bank
Product Details:
- ISBN-10 : 0131394452
- ISBN-13 : 978-0131394452
- Author: Michael Parkin
Parkins Macroeconomics is a worldwide leader because it provides a serious, analytical approach to the discipline using the latest policy and data. Parkin trains students to think like economists by offering a clear introduction to theory and applying the concepts to todays events, news, and research.
From our global food shortage to global warming, economic issues permeate our everyday lives. Parkin brings critical issues to the forefront. Each chapter begins with one of todays key issues, and additional issues appear throughout the chapter to show the real-world applications of the theory being discussed. When the chapter concludes, students read between the lines to think critically about a news article relating to the issue, demonstrating how thinking like an economist helps make informed decisions.
Table of Content:
Chapter 1:
Economics is a study of choices made by the people to cope with the scarcity.
(a)
Apple Inc decision to make iTunes freely available in unlimited quantities induces the demand for the Apple products. This decision changes the incentives of people, as it is the buyer’s self-interest to purchase the product.
For example: Consumers incentive to buy an i-pod increases due to the free music available on it.
(b)
Apple’s decision is a micro economic issue because it effects an individual firm and an individual market. The decision made by the company does not affect the entire economy.
Chapter 2:
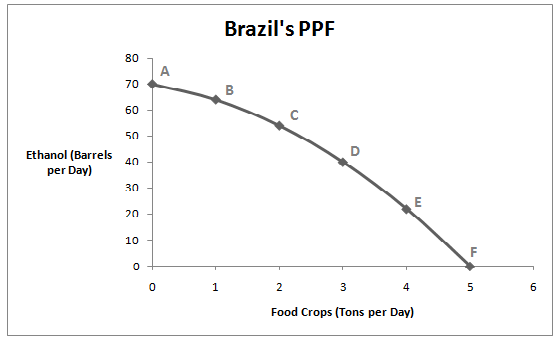
As given, the production possibilities of Brazil for ethanol and food crops are shown in the table below:
| Ethanol
(barrels per day) |
Food crops
(tons per day) |
|
| 70 | and | 0 |
| 64 | and | 1 |
| 54 | and | 2 |
| 40 | and | 3 |
| 22 | and | 4 |
| 0 | and | 5 |
Table 1
a) Based on the above information given in the table 1 about two goods – ethanol and food crops, a graph for Brazil’s PPF is drawn as below,
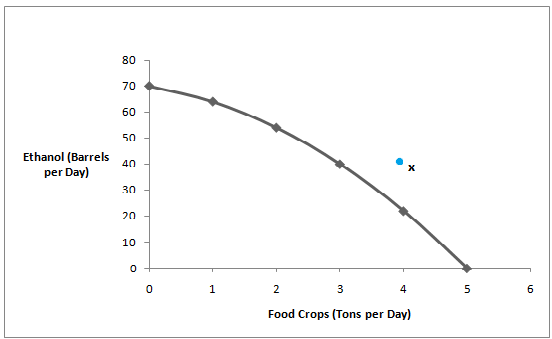
Fig: Brazil’s PPF
On the x– axis food crops and on the y– axis ethanol has been taken.
The points that lie on the curve are the cost efficient points of production of the two goods. And, the points that lie outside the PPF such as blue point x are not attainable with the given resources. Therefore, points that lie outside the PPF indicate scarcity of resources.
b) If Brazil produces 40 barrels of ethanol a day then it has to produce 3 tons of food per day to achieve production efficiency. The diagram below makes it clearer.
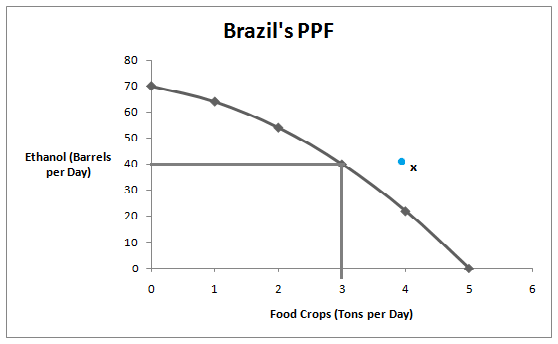
c) Brazil can’t produce all the combinations of the two goods. It has to make choice among the points on the PPF, where it can produce. All the points that lie on the PPF are least cost combinations of ethanol and food crops (A, B, C, D, E, and F). Therefore, to produce more of food crops, some ethanol production has to be given up. And, to produce more ethanol some food crop production has to be given up.
People Also Search:
macroeconomics parkin
macroeconomics 10th edition parkin
macroeconomics 10th edition download scribd
macroeconomics
parkin macroeconomics
macroeconomics 10th edition testbank download pdf
macroeconomics 10th edition
michael parkin macroeconomics 10th edition