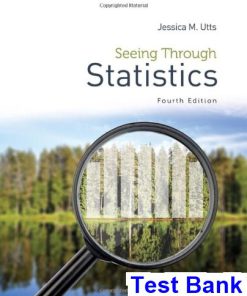
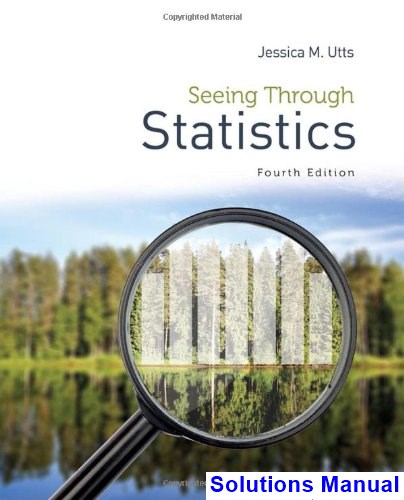
Seeing Through Statistics 4th Edition Utts Solutions Manual
You may also like
-
$26.50
$50.00
Instant download Seeing Through Statistics 4th Edition Utts Solutions Manual pdf docx epub after payment.
Product Details:
- ISBN-10 : 1285050886
- ISBN-13 : 978-1285050881
- Author: Jessica M. Utts
Table of contents:
- Part 1: Finding Data in Life
- Chapter 1: The Benefits and Risks of Using Statistics
- 1.1 Why Bother Reading This Book?
- 1.2 What is Statistics All About?
- 1.3 Detecting Patterns and Relationships
- 1.4 Don’t Be Deceived by Improper Use of Statistics
- 1.5 Summary and Conclusions
- Exercises
- Mini-Projects
- References
- Chapter 2: Reading the News
- 2.1 The Educated Consumer of Data
- 2.2 Origins of News Stories
- 2.3 How to Be a Statistics Sleuth: Seven Critical Components
- 2.4 Four Hypothetical Examples of Bad Reports
- 2.5 Planning Your Own Study: Defining the Components in Advance
- Exercises
- Mini-Projects
- References
- Chapter 3: Measurements, Mistakes, and Misunderstandings
- 3.1 Simple Measures Don’t Exist
- 3.2 It’s All in the Wording
- 3.3 Open or Closed Questions: Should Choices Be Given?
- 3.4 Defining What Is Being Measured
- 3.5 Defining a Common Language
- Exercises
- Mini-Projects
- References
- Chapter 4: How to Get a Good Sample
- 4.1 Common Research Strategies
- 4.2 Defining a Common Language
- 4.3 The Beauty of Sampling
- 4.4 Simple Random Sampling
- 4.5 Other Sampling Methods
- 4.6 Difficulties and Disasters in Sampling
- Exercises
- Mini-Projects
- References
- Chapter 5: Experiments and Observational Studies
- 5.1 Defining a Common Language
- 5.2 Designing a Good Experiment
- 5.3 Difficulties and Disasters in Experiments
- 5.4 Designing a Good Observational Study
- 5.5 Difficulties and Disasters in Observational Studies
- 5.6 Random Sample versus Random Assignment
- Exercises
- Mini-Projects
- References
- Chapter 6: Getting the Big Picture
- 6.1 Final Questions
- Mini-Projects
- References
- Part 2: Finding Life in Data
- Chapter 7: Summarizing and Displaying Measurement Data
- 7.1 Turning Data into Information
- 7.2 Picturing Data: Stemplots and Histograms
- 7.3 Five Useful Numbers: A Summary
- 7.4 Boxplots
- 7.5 Traditional Measures: Mean, Variance, and Standard Deviation
- 7.6 Caution: Being Average Isn’t Normal
- Exercises
- Mini-Projects
- References
…
People Also Search:
seeing through statistics 4th edition answers
seeing through statistics 3rd edition
how much of what you see is a hallucination
what counts as a statistic
what is the observed statistic
what is a relevant statistic
is seeing spots normal
what does c represent in statistics
e value statistics
how to get through statistics class
what does j mean in statistics


